Tides
WeatherRouting predicts the tide for the stations on the map, for secondary ports and for tidal gates. This page starts with what the tide is and why it behaves so differently from one harbour to the next. It then explains where the app’s tidal data comes from, what the levels on a tide graph mean, and how they relate to the depths on a chart.
What the tide is
Section titled “What the tide is”The tide is the rise and fall of the sea caused by the gravity of the moon and the sun, together with the tidal streams that go with it. Around our coasts it has a few familiar rhythms:
- twice a day — two high and two low waters in a little under 25 hours, because the moon returns overhead every 24 h 50 min;
- springs and neaps — the range grows and shrinks over about two weeks, as the sun’s tide works with the moon’s (at new and full moon) or against it (at the quarters);
- slower cycles — the moon’s changing distance and declination over a month, the seasons over a year, and the 18.6-year nodal cycle (see LAT and HAT).
These rhythms are astronomical and can be predicted years ahead. What a given harbour does with them — how high, how late, and with what shape of curve — is decided by the sea basins the tide travels through. That is what the rest of this section is about.
Newton’s two bulges
Section titled “Newton’s two bulges”The first explanation came from Isaac Newton in his Principia (1687). The moon pulls on every part of the earth, but slightly more strongly on the side facing it and slightly less on the far side. What is left over after the earth as a whole has been pulled along is the tide-raising force: towards the moon on the near side, away from it on the far side. The sun does the same, a little under half as strongly.
Newton imagined an earth covered by one deep ocean that is always in balance with that force — the equilibrium tide. The water would pile up in two bulges, one under the moon and one on the opposite side, and the earth would turn underneath them. Each place would pass through two bulges a day: two high waters, the semi-diurnal tide. The model also explains springs and neaps (the sun’s bulges adding to or cancelling the moon’s) and the diurnal inequality (the bulges lie off the equator when the moon has a declination).
As a description of the forces, this is right, and modern predictions still use it to know at which frequencies the sea is pushed (see The constituents). As a description of the water, it is wrong — the bulges do not exist:
- Continents are in the way. The water cannot travel round the earth with the moon; it is held in ocean basins.
- The ocean is too shallow to keep up. A tide is a long wave — far longer than the water is deep — and such a wave travels at a speed set only by the depth:
In an ocean 4,000 m deep that is about 200 m/s, roughly 700 km/h. To stay under the moon at the equator, a bulge would have to travel at about 1,600 km/h (the earth’s circumference in one lunar day). The ocean cannot follow, so instead of a bulge riding along under the moon, the forcing sets the water in each basin oscillating.
The real tide: waves in basins
Section titled “The real tide: waves in basins”Pierre-Simon Laplace laid the foundation of the dynamic theory from 1775 (Wikipedia: Theory of tides): the tide-raising forces drive the oceans as a fluid on a rotating earth, and each basin answers with its own waves, shaped by its depth, its size and its coasts. A basin whose natural period of sloshing is close to 12 hours answers strongly; one that is far off answers weakly.
Two things shape those waves.
The earth’s rotation (the Coriolis effect). Seen from the turning earth, anything that moves across it — air, water, a long-range shell — appears to be deflected: to the right in the northern hemisphere, to the left in the southern. Nothing pushes it sideways; the earth turns away underneath it. For a tide wave running along a coast, this deflection piles the water up against the coast on its right-hand side. The result is a Kelvin wave: a tide wave that leans against a coast, with the largest range at the coast and a range that dies away towards the open sea (Wikipedia: Amphidromic point).
Amphidromic points. In a basin of the right size, the tide wave runs round the basin with the coast on its right — anticlockwise in the northern hemisphere — and in the middle there is a point where the range is zero: the amphidromic point. Charts of the tide show this with two sets of lines:
- co-tidal lines join the places that have high water at the same time; they fan out from the amphidromic point like the spokes of a wheel;
- co-range lines join the places with the same range; they circle the amphidromic point, the range growing towards the coasts.
When friction weakens the wave on one side of a basin, the amphidromic point moves away from the middle — sometimes so far that it lies inland. It is then called a degenerate (or virtual) amphidrome: the coast near it has a very small range, but nowhere does it reach zero.
The Channel and the southern North Sea
Section titled “The Channel and the southern North Sea”The tide of Northwest Europe comes in from the Atlantic. It enters the Channel from the west and the North Sea mainly round the north of Scotland, with a smaller part through the Dover Strait (Coastal Dynamics, TU Delft).
Why the French coast has the bigger tides. In the Channel the tide is a Kelvin wave travelling east. Its right-hand side is the French coast, so that is where the water piles up. Part of the wave is reflected at the Dover Strait and runs back west, leaning on the English coast, but it has lost much of its energy on the way, so it cannot balance the eastbound wave. In the western Channel the tide behaves mostly as a progressive wave, in the east more as a standing oscillation; the Coriolis effect draws the co-tidal lines together towards the Isle of Wight to a degenerate amphidromic point (UK Strategic Environmental Assessment 8, oceanography report). TICON-4’s constants show the result plainly — compare the amplitude of M2, the main lunar tide, on the two sides:
| French side | M2 amplitude | English side | M2 amplitude |
|---|---|---|---|
| Saint-Malo | 3.67 m | Weymouth | 0.60 m |
| Cherbourg | 1.87 m | Swanage | 0.37 m |
| Le Havre | 2.62 m | Portsmouth | 1.40 m |
| Dieppe | 3.10 m | Newhaven | 2.25 m |
M2 amplitudes from TICON-4; the spring range is roughly twice M2 plus S2.
At the head of the Gulf of Saint-Malo the funnel-shaped Bay of Mont-Saint-Michel adds to this, with ranges of about 14 m at big spring tides — the largest in Europe. On the English side, between Weymouth and Swanage, the range drops to little more than a metre, near the degenerate amphidrome.
The North Sea has three amphidromic points for the M2 tide (Wikipedia: Amphidromic point), the tide circling each of them anticlockwise. The southernmost lies between East Anglia and the Netherlands, which is why both coasts there have small ranges — Lowestoft and IJmuiden each have an M2 amplitude of only about 0.7 m in TICON-4 — while the Dover Strait, further from it, has about 2.2 m.
Shallow water: slower, higher and out of shape
Section titled “Shallow water: slower, higher and out of shape”Slower. By , a tide wave slows down as the water gets shallower: from about 200 m/s over the deep ocean to some 20 m/s over a 40 m deep shelf sea. That is why high water arrives hours later at the head of the Channel than at its mouth.
Higher. As the wave slows, its energy is squeezed into a shorter, narrower wave, and its height grows. For a gradual change in depth and width , Green’s law gives the amplitude as
so a wave entering water a sixteenth as deep doubles in height, and a funnelling bay that narrows to a quarter of its width doubles it again (Wikipedia: Green’s law). Friction works against this, and resonance of the basin can add to it.
Out of shape. In deep water the tide is close to a pure sine wave. In shallow water it is not, for two reasons:
- the crest of the wave is in deeper water than the trough, so it travels faster (, with the tide’s own height): the rising tide catches up and becomes shorter and steeper than the falling tide;
- friction on the sea bed is much stronger in shallow water, and works more strongly on strong streams than on weak ones.
Both effects are non-linear, and a non-linear distortion of a sine wave adds waves at multiples and combinations of its frequency. These are the shallow-water constituents: overtides such as M4 (twice the frequency of M2) and M6, and compound tides such as MS4 (M2 combined with S2) and MN4. They have no counterpart in the astronomical forcing; they are made by the sea floor and the coast.
Odd curves: Poole and IJmuiden
Section titled “Odd curves: Poole and IJmuiden”Where the main tide is small, the overtides it creates stay about the same size — and then they take over the shape of the curve.
Poole and the Solent. Poole lies close to the degenerate amphidrome of the Channel. Its mean spring range is only 1.6 m, against 3.9 m at Portsmouth (Poole Harbour and its tides, with information from the UK Hydrographic Office). With so small a main tide, the shallow-water tide makes the curve: Poole has a double high water (a long stand at the top), Portland and Weymouth a double low water, and Southampton its famous double high water with a young flood stand — a pause in the rising tide. The often-told explanations — two tide waves arriving round both sides of the Isle of Wight, or through the Solent’s two entrances — are not the cause of the double high water (Southampton VTS: Southampton tides; Poole Harbour and its tides).
TICON-4 has no gauge in Poole Harbour itself; the nearest are Bournemouth, on Poole Bay, and Swanage. At Bournemouth M4 is almost half the size of M2 (0.19 m against 0.41 m), and the predicted curve shows it:
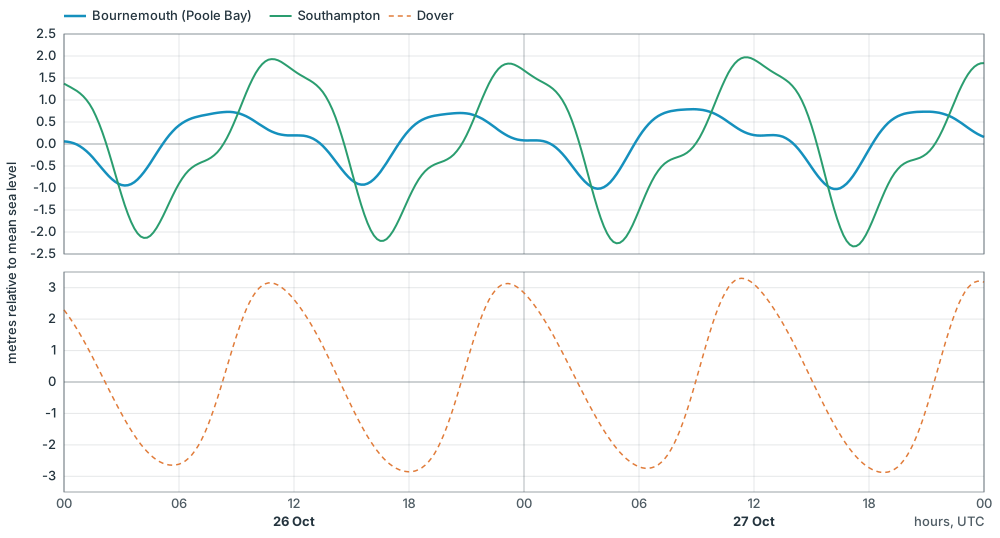
Predicted tide at springs, 26–27 October 2026 (UTC), from TICON-4’s constants as WeatherRouting computes them. Top: Bournemouth (Poole Bay) and Southampton; bottom: Dover, for comparison.
IJmuiden and the Dutch coast. On the Dutch coast, close to the North Sea’s southern amphidrome, the main tide is small too (an M2 amplitude of about 0.7 m at IJmuiden) and the overtides are large (M4 is 0.2 m). The tide rises fast and falls slowly, and near springs the real curve at IJmuiden shows a false low and high: during the fall the water stops, rises a little, and only then goes on to low water. Further south, at Hoek van Holland, the same family of effects gives the double low water (Rijkswaterstaat: Dubbel eb en vloed).
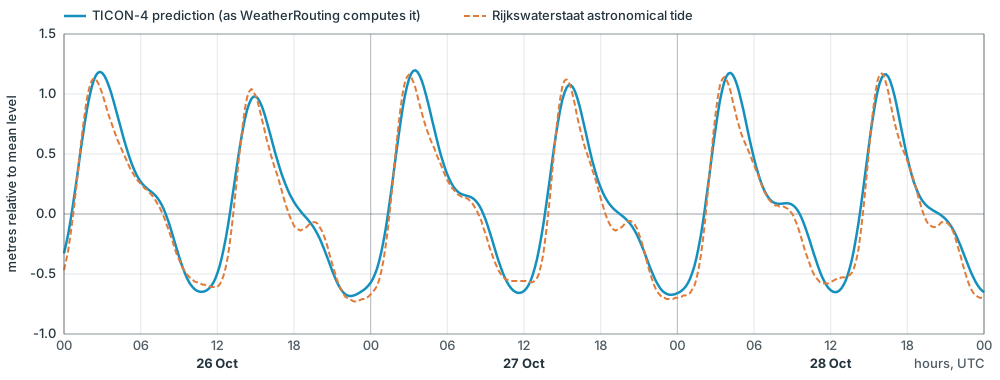
IJmuiden Buitenhaven at springs, 26–28 October 2026 (UTC). Solid: the TICON-4 prediction as WeatherRouting computes it. Dashed: Rijkswaterstaat’s astronomical tide (Rijkswaterstaat water data, “Waterhoogte astronomisch”), shifted from NAP to its own mean over the surrounding month so both curves share one reference.
The likely reason is the set of constituents. TICON-4 gives 50 constituents per gauge. Rijkswaterstaat’s analysis software, hatyan, uses a standard set of 94 for a year of North Sea data (hatyan source, get_const_list_hatyan('year')). 69 of those 94 are not in TICON-4 — among them many compound shallow-water tides of higher order: twelve sixth-diurnal (such as 2MN6, MSN6, 2MK6, 2SM6), eight eighth-diurnal (such as 3MS8, 3MN8, 2MSN8), six tenth-diurnal (such as M10, 4MS10) and four twelfth-diurnal (such as M12). A sharp kink like IJmuiden’s false low needs exactly these fast, high-order terms.
(Estimating tidal constituents in shallow waters from satellite altimetry using a 2D hydrodynamic model with nonlinear tide-surge interactions).
The constituents
Section titled “The constituents”A tide prediction adds up a set of constituents: pure cosine waves, each with a fixed speed that comes from astronomy, and an amplitude and phase that belong to the place (see From tidal constants to a water level). The figure shows how the largest ones build up the tide at Dover at springs:
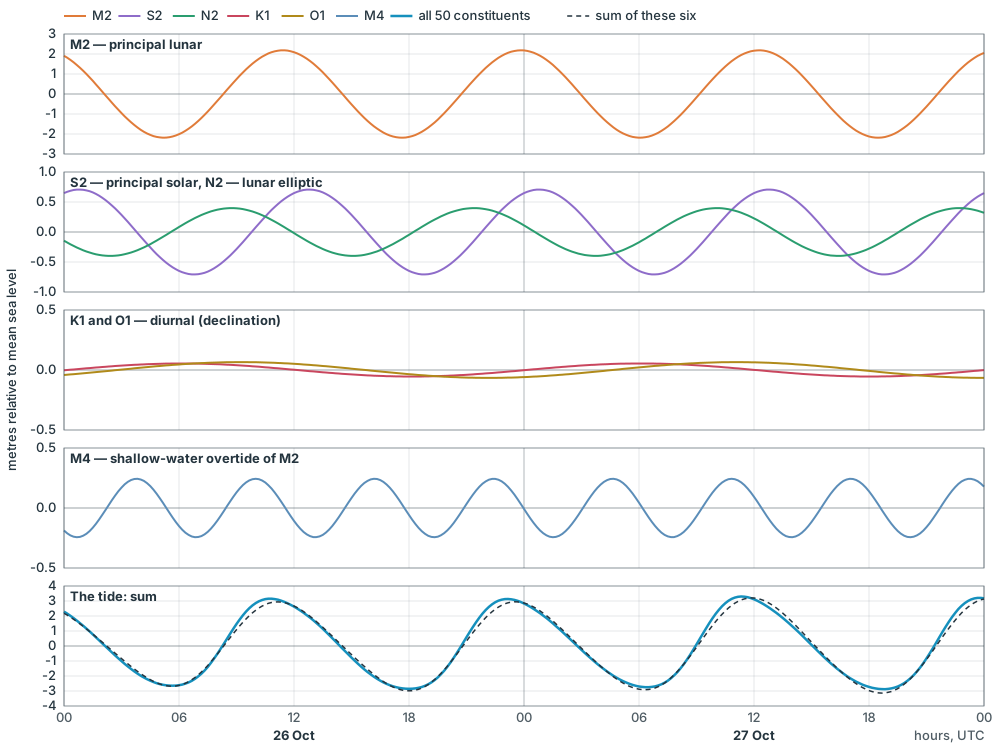
Dover at springs, 26–27 October 2026 (UTC): six constituents from TICON-4 and their sum, against the full prediction from all 50 constituents.
The main constituents, and where they come from:
| Symbol | Name | Period | Origin |
|---|---|---|---|
| M2 | principal lunar semi-diurnal | 12.42 h | the moon’s tide-raising force, twice a lunar day |
| S2 | principal solar semi-diurnal | 12.00 h | the sun’s tide-raising force, twice a solar day; with M2 it makes springs and neaps |
| N2 | larger lunar elliptic | 12.66 h | the moon’s varying distance (its elliptic orbit) |
| 2N2 | lunar elliptic, second order | 12.91 h | the moon’s elliptic orbit, second order |
| K2 | luni-solar declinational | 11.97 h | the declination of the moon and sun |
| NU2, MU2, L2, T2, λ2 | smaller semi-diurnal terms | 12.0–12.9 h | finer details of the moon’s and sun’s orbits (evection, variation, the earth’s ellipse round the sun) |
| K1 | luni-solar diurnal | 23.93 h | the declination of the moon and sun: the diurnal inequality |
| O1 | principal lunar diurnal | 25.82 h | the moon’s declination |
| P1 | principal solar diurnal | 24.07 h | the sun’s declination |
| Q1 | larger lunar elliptic diurnal | 26.87 h | the moon’s declination and elliptic orbit |
| J1, OO1 | smaller diurnal terms | 23.10 h, 22.31 h | the moon’s declination and elliptic orbit |
| M3 | lunar ter-diurnal | 8.28 h | a small third-order term of the moon’s force |
| M4 | shallow-water overtide of M2 | 6.21 h | non-linear distortion of M2 in shallow water |
| MS4, MN4 | shallow-water compound tides | 6.10 h, 6.27 h | M2 interacting with S2, or with N2 |
| M6, 2MS6, M8 | higher overtides and compounds | 4.14 h, 4.09 h, 3.11 h | further non-linear distortion in shallow water |
| MF | lunar fortnightly | 13.66 days | the moon’s declination |
| MM | lunar monthly | 27.55 days | the moon’s elliptic orbit |
| MSF | luni-solar synodic fortnightly | 14.77 days | mostly the spring–neap interaction in shallow water |
| SA, SSA | solar annual and semi-annual | 365.24 and 182.62 days | partly the sun, mostly the seasons: water temperature, winds and river flow |
Periods computed from the constituent speeds in WeatherRouting’s tide code; origins after the standard classification (NOAA: harmonic constituents).
TICON-4 gives these 50 constituents for every gauge: 2MK5, 2MO5, 2MS6, 2N2, 2Q1, 2SM2, 3L2, 3N2, EP2, J1, K1, K2, L2, λ2, M1, M2, M3, M4, M6, M8, MA2, MB2, MF, MKS2, MM, MN4, MS4, MSF, MSQM, MTM, MU2, N2, N4, NU2, O1, OO1, P1, Q1, R2, R3, ρ1, S1, S2, S3, S4, SA, σ1, SSA, T2 and T3.
TICON-4
Section titled “TICON-4”The project
Section titled “The project”TICON-4 (TIdal CONstants based on GESLA-4 sea-level records) is a database of tidal constants published in 2025 by Michael Hart-Davis, Denise Dettmering and Florian Seitz of the Deutsches Geodätisches Forschungsinstitut at the Technical University of Munich (DGFI-TUM). It is the fourth version of TICON, first published by Piccioni and others in 2019.
The constants were computed from the sea-level records collected in GESLA-4, the Global Extreme Sea Level Analysis collection of tide gauge records from national agencies around the world. TICON-4 contains 50 tidal constituents for 4,383 tide gauges worldwide (SEANOE record).
What the data holds
Section titled “What the data holds”For every gauge and every constituent — M2, S2, N2, K1, O1 and the rest — TICON-4 gives:
- the amplitude and the phase lag of the constituent, each with its estimated error;
- the gauge’s name, country and position;
- the record the constants came from: its first and last date, the number of years observed, and how much of it is missing;
- the source of the record within GESLA-4 (for the Netherlands, for example, Rijkswaterstaat’s current or historical series);
- a type label — Coastal, River or Lake — and a note on the record’s quality;
- the datum the original sea-level record was measured in, such as NAP for the Dutch gauges.
TICON-4 does not give LAT or HAT. The constants describe the tide’s swing around the mean level of the record, so a prediction from them is a height relative to mean sea level over the years the gauge was recording. WeatherRouting works out LAT and HAT itself (see How WeatherRouting computes them).
Licence and credit
Section titled “Licence and credit”TICON-4 is published under the Creative Commons Attribution 4.0 licence. Its authors ask to be credited as:
Hart-Davis, M., Dettmering, D., Seitz, F. (2025). TICON-4: TIdal CONstants based on GESLA-4 sea-level records. SEANOE. doi:10.17882/109129
Piccioni, G., Dettmering, D., Bosch, W., Seitz, F. (2019). TICON: TIdal CONstants based on GESLA sea-level records from globally located tide gauges. Geoscience Data Journal 6(2), 97–104. doi:10.1002/gdj3.72
Which stations WeatherRouting shows
Section titled “Which stations WeatherRouting shows”WeatherRouting takes the TICON-4 gauges of Northwest Europe and turns them into one station per place:
- No gauge is left out for its label. TICON-4’s type labels are not reliable for a sailor: the gauges at Yerseke and Stavenisse in the Oosterschelde are labelled River, while those on the IJsselmeer side of the Afsluitdijk are labelled Coastal. So every gauge is kept — even one on enclosed water, which then simply shows a flat line.
- The current record first. Many places have both a current series and a longer historical one, usually because new equipment replaced old. WeatherRouting uses the current series when it covers at least five years, and the historical one only when there is no current one.
- Gauges close together are merged only when they see the same tide. Two gauges within 2 km are one station only if their main constants agree. A gauge inside a lock or a narrow inlet stays a station of its own.
- Every station shows its record period, so you can see that a station rests on, say, observations from 1973 to 1987.
Coming later: an interactive station explorer on this page, to pick a station and see its constants and its tide curve.
Secondary ports
Section titled “Secondary ports”For a place without a gauge — a marina entrance, a sill, a bar — WeatherRouting uses the method of the printed tide tables: a standard port with its own prediction, plus the almanac’s differences for the secondary port. The time differences for high and low water are given for springs and for neaps, and the height differences for mean high and low water at springs and neaps. For each tide the app interpolates between the spring and neap differences according to the standard port’s range that day.
This interpolation is the usual practice, and it is an approximation: it assumes the secondary port responds to the moon and sun as the standard port does (Rossiter, International Hydrographic Review). The closer and more alike the two ports, the better it works.
LAT and HAT
Section titled “LAT and HAT”Definitions
Section titled “Definitions”The International Hydrographic Organization (IHO) defines both levels in its hydrographic dictionary (S-32):
Lowest Astronomical Tide (LAT): the lowest tide level which can be predicted to occur under average meteorological conditions and under any combination of astronomical conditions.
Highest Astronomical Tide (HAT) is the same with highest.
The IHO’s Resolution 3/1919 (as amended in 2008) asks hydrographic offices, where the tide has an appreciable effect on the water level, to adopt LAT — “or as closely equivalent to this level as is practically acceptable” — as chart datum, and HAT as the datum for vertical clearances under bridges and cables. A 2016 proposal to revise the wording was put to the member states (to verify: whether it was adopted, and the current text in IHO publication M-3).
Most charts of Northwest Europe use LAT, so the depths on the chart are what you have at the lowest predictable tide, and the clearance under a bridge is what you have at the highest.
Two words in the definition matter:
- Predicted — LAT is a property of the tide prediction, not of observed water levels. A storm or high air pressure can push the real water level below LAT.
- Any combination of astronomical conditions — the moon and sun must be in their most extreme combination. These repeat over the lunar nodal cycle of about 18.6 years, so a prediction has to cover at least that long. IHO guidance asks for at least 19 years of prediction, from harmonic constants based on at least one year of observations (to verify: the exact wording of this guidance).
From tidal constants to a water level
Section titled “From tidal constants to a water level”TICON-4 gives, for each gauge, a set of tidal constituents: for constituent an amplitude and a phase lag . The predicted height above mean sea level at time is the sum of all of them:
where is the constituent’s speed, its astronomical argument at the start time, and and the nodal corrections that slowly change it over the 18.6-year cycle.
How WeatherRouting computes them
Section titled “How WeatherRouting computes them”WeatherRouting predicts the tide at every gauge hourly over the 19 years 2000–2018, a full nodal cycle, and takes the lowest and highest values. The best few hourly lows and highs are then refined to the exact turning point of the curve, so a peak that falls between two hours is not missed. The window is fixed, not “the coming 19 years”, so the same constants always give the same LAT and HAT.
For example, at Harlingen this gives:
| Level | Height relative to mean sea level |
|---|---|
| HAT | +1.32 m |
| LAT | −1.44 m |
These are LAT and HAT of the prediction from TICON-4’s constants, relative to the mean level of the gauge’s record. They come close to, but need not equal, the levels in the official tide tables, which hydrographic offices compute from their own analyses and round to their chart datum (see below).
For a secondary port, LAT and HAT are not given by the almanac. WeatherRouting estimates them from the standard port’s LAT and HAT, shifted by the secondary port’s spring height differences, and marks them as approximate.
LAT beside the land datums
Section titled “LAT beside the land datums”Every country has its own land datum, the zero of its heights on land, and each was fixed long ago in its own way. Between Dover and Antwerp four of them meet:
- OD Newlyn (Ordnance Datum Newlyn), Great Britain: the mean sea level at Newlyn in Cornwall, 1915–1921.
- IGN 1969, France: the national levelling of the Institut Géographique National.
- TAW (Tweede Algemene Waterpassing), Belgium: the second general levelling, about 2.3 m below the Dutch NAP — Belgian heights on land are therefore larger by that much.
- NAP (Normaal Amsterdams Peil), the Netherlands: based on the mean high water of the IJ at Amsterdam in 1684, and today within a few centimetres of the mean sea level along the Dutch and Belgian coast.
Next to them lie the chart datums. Before LAT, Belgium and the Netherlands charted to GLLWS (Gemiddeld Laag Laag Water Spring, mean lower low water at springs, also written H), and the Flemish sheet below lists a former French reduction level, OCM, at Dunkerque and Gravelines; France today charts to its zéro hydrographique (see Chart datum at a single point) (to verify: whether OCM and today’s zéro hydrographique at Dunkerque are the same level). Today they all chart to LAT, or close to it — and LAT is not one level but different at every port, because the tide’s range is.
The Flemish Hydrography publishes a sheet that sets all these levels side by side, relative to TAW (Referentievlakken, state of 1 January 2011, updated with LAT from 2021 and ALAT from 2026). Redrawn from that sheet:
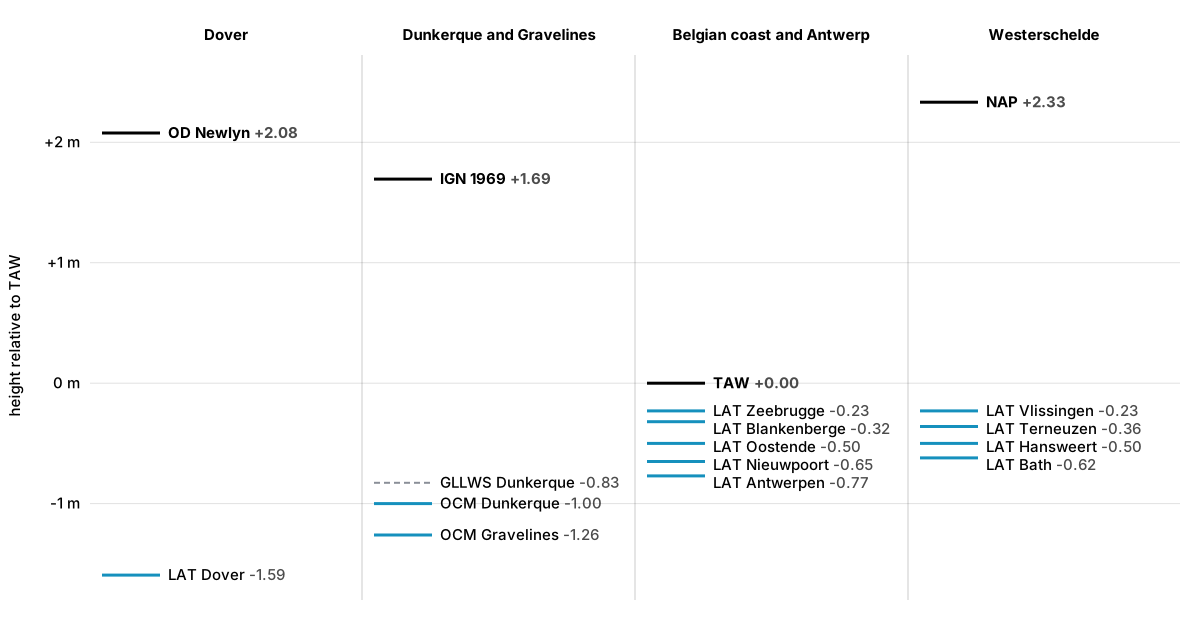
Land datums (black) and chart datums (blue; dashed: the former GLLWS) between Dover and Antwerp, in metres relative to TAW.
| Level | What it is | Relative to TAW | Relative to NAP |
|---|---|---|---|
| NAP | Dutch land datum | +2.333 m | 0 |
| OD Newlyn | British land datum | +2.077 m | −0.256 m |
| IGN 1969 | French land datum | +1.694 m | −0.639 m |
| TAW | Belgian land datum | 0 | −2.333 m |
| LAT Zeebrugge, LAT Vlissingen | chart datum | −0.230 m | −2.563 m |
| LAT Terneuzen | chart datum | −0.360 m | −2.693 m |
| LAT Oostende | chart datum | −0.500 m | −2.833 m |
| LAT Hansweert | chart datum | −0.500 m | −2.833 m |
| LAT Bath | chart datum | −0.620 m | −2.953 m |
| LAT Nieuwpoort | chart datum | −0.650 m | −2.983 m |
| LAT Antwerpen | chart datum | −0.770 m | −3.103 m |
| H (GLLWS) Dunkerque | former chart datum | −0.827 m | −3.160 m |
| OCM Dunkerque (east) | French chart datum (OCM) | −1.000 m | −3.333 m |
| OCM Gravelines (Dunkerque west) | French chart datum (OCM) | −1.260 m | −3.593 m |
| LAT Dover | British chart datum | −1.593 m | −3.926 m |
What the sheet shows:
- LAT drops where the range grows. Along the Belgian coast LAT lies 0.23 m below TAW at Zeebrugge and 0.65 m at Nieuwpoort; up the Westerschelde it goes from 0.23 m below TAW at Vlissingen to 0.62 m at Bath and 0.77 m at Antwerp, as the estuary funnels the tide (see Shallow water). At Dover, with a much bigger range, LAT lies 3.67 m below OD Newlyn — almost 4 m below NAP.
- The step at a border is not a step in the water. Dunkerque’s chart datum and Nieuwpoort’s LAT are 0.35 m apart, 30 km from each other: partly a real difference in the tide, partly the different ways each office fixed its datum. This is why the North Sea countries work towards one common LAT surface (see From points to a surface).
- The same name, a different level. A Belgian height in TAW and a Dutch height in NAP differ by 2.33 m; a depth on a Belgian chart and on a Dutch chart, both “below LAT”, refer to levels that differ from port to port by decimetres.
- The name ALAT. Since 1 January 2026 in the Netherlands and 1 February 2026 in Belgium, LAT on charts and in tide tables is called ALAT, Approximate Lowest Astronomical Tide. The level itself did not change; the new name says honestly that a chart datum is an agreed approximation of the true LAT.
Sources for this section
Section titled “Sources for this section”- Vlaamse Hydrografie, Referentievlakken — diagram of the reference levels from Dover to Antwerp, state of 1 January 2011, updated with LAT (2021) and ALAT (2026), tide tables 2021. (To verify: the publication’s web address, to link it here.)
- Netherlands Hydrographic Service, coordinate reference systems for depth measurement at sea and NLLAT2018.
From LAT to chart datum
Section titled “From LAT to chart datum”LAT as computed above is a level at one gauge, relative to that gauge’s mean sea level. A chart needs more: one datum that holds for every sounding on it, and that the hydrographic office can tie to the land’s own height system, so that surveys, coastlines, bridges and gauges all fit together.
Chart datum at a single point
Section titled “Chart datum at a single point”At a tide gauge, a hydrographic office first analyses a long record of observations into tidal constants, predicts at least a nodal cycle ahead and takes the lowest value: LAT, relative to the gauge’s zero. The gauge’s zero is levelled to the national land datum, so LAT can be stated as so many metres below the land datum. Chart datum is then fixed at, or close to, that level.
How the countries around the southern North Sea and the Channel do it:
- United Kingdom. The UK Hydrographic Office chooses chart datum at each port to be as close as possible to LAT, and states it as a distance below Ordnance Datum Newlyn, the land datum of Great Britain — the mean sea level at Newlyn from 1915 to 1921. Because LAT moves slightly as it is recomputed, chart datum can only be “approximately LAT”, as the title notes of British charts say (NTSLF datums sheet; UK paper to the IHO).
- France. Charts and tide tables share the zéro hydrographique, defined at the reference port of each tide zone. It should be close to LAT (plus basse mer astronomique, the level of a coefficient-120 tide), but historically it can differ noticeably. Because every chart of the zone would have to change at once, Shom only moves the zéro hydrographique when it is far off — more than about 50 cm. Shom publishes each port’s zéro hydrographique relative to the land datum IGN69 in its yearly Références Altimétriques Maritimes (CNIG; data.gouv.fr).
- Belgium. Belgian charts long used a local mean lower low water springs level (GLLWS), which rises towards the north-east along the coast. The Flemish tide tables now give heights above LAT, and state the land datum TAW as lying between about 0.23 m (Zeebrugge) and 0.77 m (Antwerp) above it (Flemish tide tables, via VLIZ). The Flemish Hydrography changed its chart datum from GLLWS to LAT in 2008, and since 1 February 2026 calls it ALAT (see LAT beside the land datums).
- Netherlands. Dutch charts used GLLWS until 2005, when the Hydrographic Service decided to change to LAT; the charts were converted from mid-2006, north to south. LAT lies in general 2 to 3 decimetres below the old level, so charted depths became smaller and predicted heights larger (Hydro International). Germany changed to LAT in 2005 too. On land the Dutch datum is NAP. Since 1 January 2026 the Dutch charts call their datum ALAT (Approximate LAT), in line with the other North Sea countries; the level itself did not change (Netherlands Hydrographic Service).
From points to a surface
Section titled “From points to a surface”Away from the gauges, nobody measures LAT. Yet every sounding offshore needs a chart datum, and modern surveys measure depth with satellite positioning relative to the ellipsoid, not to a tide gauge. So hydrographic offices build LAT as a continuous surface: a grid giving, everywhere, how far LAT lies below the ellipsoid and below the land datum.
The surface is built from a tide model — the same harmonic method, but computed for every grid point of a hydrodynamic model of the sea — that is fitted to the gauges along the coast, and tied to the ellipsoid with satellite altimetry and a geoid model. Examples around the North Sea:
- VORF (Vertical Offshore Reference Frames), by University College London for the UK Hydrographic Office, completed in 2008 for the UK and Ireland. It gives LAT, mean sea level and chart datum as surfaces on a grid of about 1 km. Around 700 local chart datums were tied into it, and the chart datum surface was made by warping the LAT surface to fit them exactly (UCL; Wikipedia).
- NLLAT2018, the Dutch surface for the territorial sea and the economic zone. It gives the separations between the geoid, the ellipsoid and LAT, with LAT accurate to better than 10 cm and the geoid to better than 3 cm at sea; for the Westerschelde, Oosterschelde and Wadden Sea it uses a separation from 2006 (Netherlands Hydrographic Service).
- BLAST (Bringing Land and Sea Together), an Interreg North Sea project of 2009–2012 led by the Norwegian Hydrographic Service. It combined global tide models with the national LAT models into one LAT surface for the North Sea (BLAST datums report; Hydro International). The North Sea Hydrographic Commission has continued work towards a common LAT for the whole North Sea.
- Bathyelli ZH/ell, Shom’s surface of the zéro hydrographique relative to the ellipsoid along the French coast (Shom specification).
What this means for you
Section titled “What this means for you”- Offshore, chart datum is a model. Its accuracy is in the order of a decimetre, not a centimetre. Where national surfaces meet, there can be small steps, which is one reason the North Sea countries are working on a common LAT.
- Chart datum is not always LAT. In France in particular, the zéro hydrographique of a port can lie some way above or below the port’s LAT. Read the chart’s title notes.
- WeatherRouting’s LAT at a station is its own. It is computed from TICON-4’s constants at that gauge, relative to the gauge’s mean sea level, and can differ by some centimetres from the chart datum of the official tables there. For a secondary port it is an estimate from the standard port. Use it to judge the tide, and the official tables and the chart for depths that matter.
Free software under AGPL-3.0-or-later · Source code · Credits
Generated using E.U. Copernicus Marine Service Information; https://doi.org/10.48670/moi-00054